A user journey map is a visual representation of every interaction a prospect has with your brand, starting with the tracking macros that capture the first click on an ad or affiliate link, through to the moment they convert and beyond, mapped against their goals, emotions, and the channels that carried them there.
For performance marketers, it is the single artifact that turns a scattering of clicks, impressions, and postbacks into a coherent story of why someone converted, not just that they did.
If you run performance marketing campaigns, whether through affiliate networks, paid media, influencer partnerships, or a mix of all three, you already have the raw data to build one: click IDs, UTM parameters, postback events, session logs, and CRM records. What most B2B teams lack is the connective tissue between them.
A user journey map is that connective tissue. It takes fragmented touchpoint data and turns it into a decision-making tool that product, marketing, and growth teams can actually use.
This article walks through what a user journey map is, why it has become non-negotiable for B2B performance marketing in 2026, how it differs from a customer journey map or a marketing funnel, the stages and components every map needs, a step-by-step process for building one, and how journey mapping connects directly to attribution, tracking, and the technical infrastructure that proves which touchpoints actually drove revenue.
Why User Journey Mapping Matters in Performance Marketing?
B2B buying has stopped looking anything like a straight line. Purchases now routinely involve six to ten stakeholders, with roughly seventy to eighty percent of the journey completed before a prospect ever contacts sales.
Some research puts the number of distinct interactions across channels even higher, with buyers moving through dozens of touchpoints before a considered purchase closes.
Whatever the exact figure, the pattern is consistent: by the time someone fills out a demo form, clicks a “buy now” button, or converts through an affiliate link, they’ve already been influenced by content, peer reviews, ads, retargeting, and word of mouth that your reporting dashboard probably never captured.
This is the core problem a user journey map solves. Most performance marketing stacks are built to report on the last click, the touchpoint that happened to be closest to the conversion, because it’s the easiest one to track.
But a large share of B2B marketing teams still rely on last-touch attribution, crediting only the final interaction while ignoring everything that came before it, which routinely leads to misallocated budget and missed opportunities.
When you don’t know which earlier touchpoints actually moved a buyer forward, you end up cutting the campaigns that quietly did the heavy lifting and doubling down on the one that happened to be there at the end.
There’s also a visibility problem specific to 2026. A large and growing share of research now happens where no tracking pixel can reach it: private communities, peer recommendations, review sites, and increasingly, AI assistants that buyers ask to shortlist vendors on their behalf.
According to Gartner’s B2B buying research, buyers now complete roughly 67% of their purchase journey, researching anonymously across these channels, before ever engaging directly with a vendor’s sales team.
A user journey map doesn’t eliminate that blind spot, but it forces your team to design for it: to identify where in the journey those anonymous, untrackable interactions are most likely to happen, and to make sure your visible touchpoints (the ones you can actually track and optimize) are positioned to catch buyers on the way out of that dark funnel.
For a performance marketing team specifically, mapping the journey also does something more tactical: it tells you where your tracking infrastructure needs to be strongest. If most of your conversion value comes from a multi-week journey spanning a paid click, an app install, and a delayed in-app purchase, your conversion tracking using postback setup has to be airtight at every one of those handoffs, or you lose the ability to prove attribution at all.
User Journey Map vs. Customer Journey Map vs. Marketing Funnel: What’s the Difference?
These three terms get used interchangeably, but they answer different questions, and mixing them up leads to maps that try to do too much at once.
- A user journey map is typically product- and interaction-focused. It tracks a specific user through a specific task or goal, such as signing up for a free trial, configuring their first tracking link, or completing onboarding. It’s granular, usually tied to UX and product analytics, and often built at the level of individual screens, clicks, and micro-interactions.
- A customer journey map is broader. It spans the entire relationship, from first awareness through purchase, onboarding, renewal, and advocacy, and it usually blends multiple channels: marketing, sales, support, and product. It’s less about a single task and more about the emotional and business arc of the relationship.
- A marketing funnel is narrower still. It’s a linear, stage-based model used mainly to describe volume and conversion rate at each stage. Funnels are useful for forecasting and pipeline math, but they flatten out the back-and-forth, non-linear reality of how buyers actually behave.
Most B2B performance marketing teams need a hybrid: a user journey map that’s detailed enough to show individual touchpoints and channels, like a UX journey map, but wide enough to span the full pre-purchase and post-purchase relationship, like a customer journey map, with funnel-stage labels layered on top so it still ties back to pipeline reporting. That hybrid is what the rest of this guide describes.
What are the Core Stages of a User Journey Map?
Every B2B user journey map, regardless of industry, tends to follow the same four to six stages. The names vary by team, but the underlying logic doesn’t.
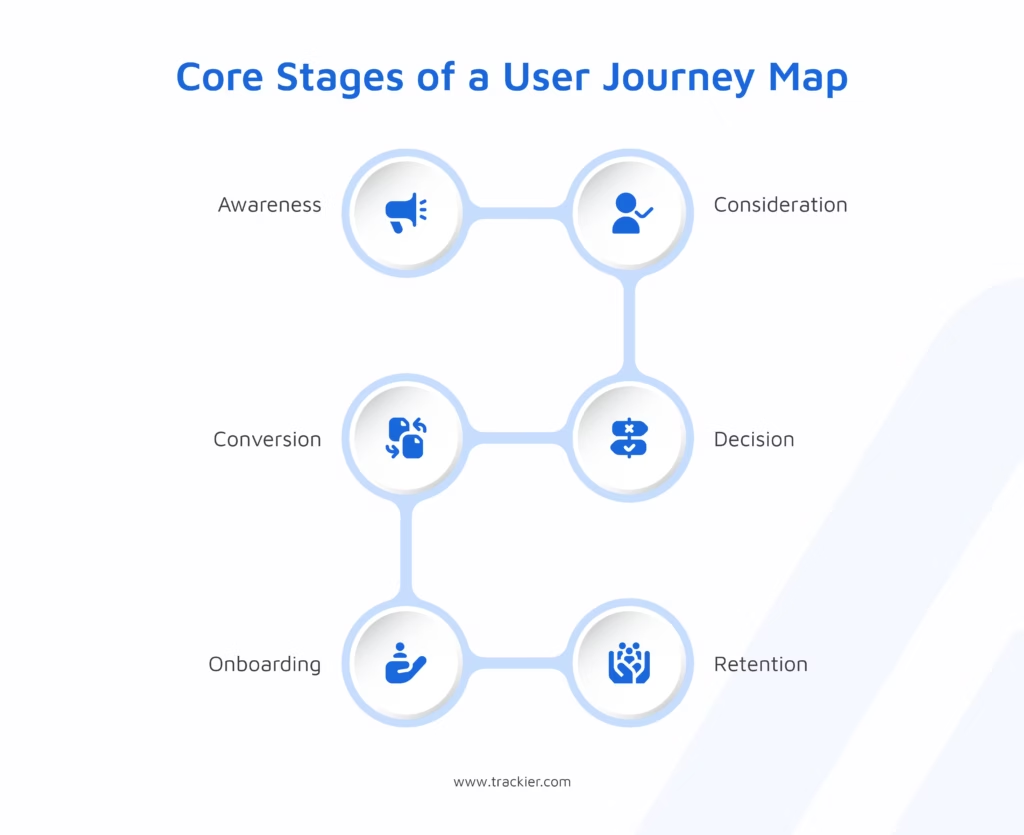
1. Awareness – The buyer recognizes a problem or opportunity and starts looking for information. They may not know your brand, or any brand, exists yet. Touchpoints here include organic search, social content, paid display, affiliate and influencer placements, and word of mouth.
Some research suggests that more than half of the buying process happens before a buyer ever engages with sales, and a majority of journeys begin with a search engine query.
This is also the stage where a large volume of clicks originates from performance channels, affiliate links, paid social, and comparison sites, so tracking accuracy at the point of first click matters enormously for everything that follows.
2. Consideration – The buyer has framed their problem and is now evaluating categories of solutions. They’re consuming deeper content: comparison guides, webinars, analyst reports, case studies.
In B2B specifically, this stage often stretches out because multiple stakeholders are independently researching in parallel before regrouping to compare notes.
3. Decision – The buying committee has narrowed its options and is now validating a specific vendor: requesting demos, checking reviews, running security or procurement reviews, and negotiating terms.
This is typically the shortest stage by calendar time but the highest-stakes one, since a single blocked stakeholder (legal, procurement, IT) can stall a deal that was otherwise ready to close.
4. Conversion – The moment of commitment: a signed contract, a completed purchase, a submitted form that triggers a sales handoff, or, in an affiliate/performance context, the tracked action that fires a postback and credits a partner.
This is the stage every performance marketing report is ultimately built to explain.
5. Onboarding – Often left off journey maps entirely, but critical for B2B: the gap between “signed” and “successfully using the product” is where a meaningful share of early churn happens.
Mapping this stage connects marketing’s promises to what the product actually delivers in the first 30–90 days.
6. Retention – The buyer becomes a renewing customer, an expansion opportunity, or a referral source.
For performance teams running partner or affiliate marketing programs, this stage also loops back to the top: a satisfied customer becomes a case study, a review, or even a new affiliate partner themselves.
Key Components of an Effective User Journey Map
A stage-by-stage skeleton isn’t a journey map on its own. Each stage needs to be filled in with the same set of components so the map is comparable across stages and usable by different teams.
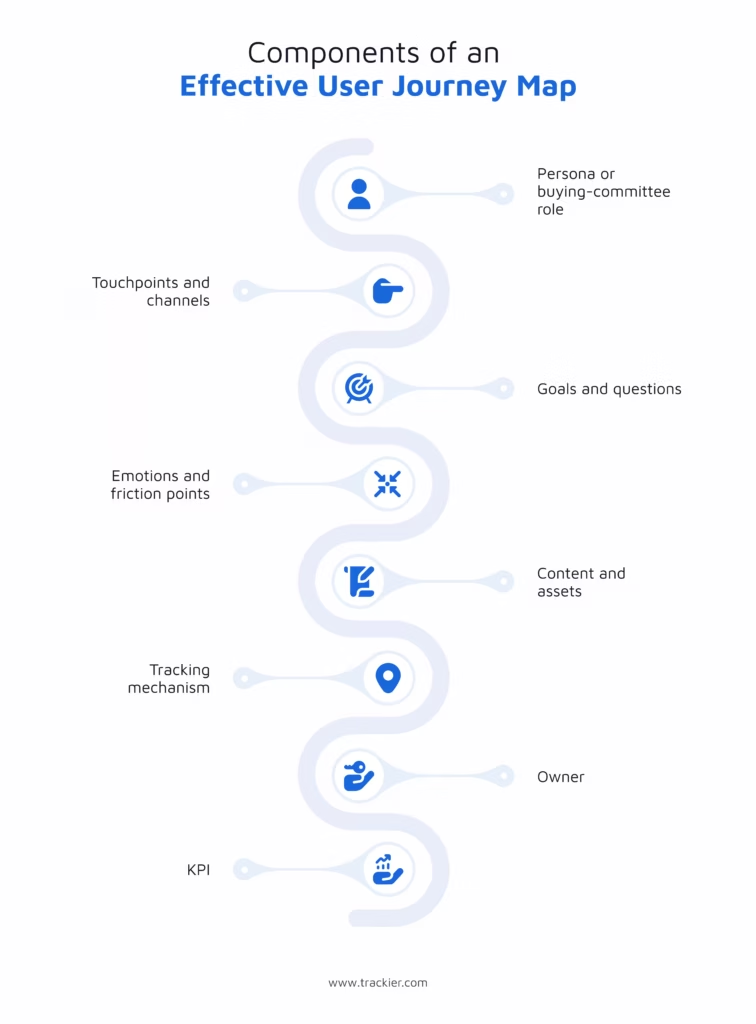
- Persona or buying-committee role – who is acting at this stage (economic buyer, technical evaluator, end user, procurement)?
B2B journeys almost always involve more than one persona moving through the map at different speeds.
- Touchpoints and channels – the specific interaction (a LinkedIn ad, an affiliate review page, a product demo, a pricing page visit) and the channel it occurred on.
- Goals and questions – what is the buyer trying to accomplish or answer at this exact moment? Content and messaging should map directly to this.
- Emotions and friction points – where does confidence build, and where does it break down? Long security reviews, unclear pricing, and unresponsive support are common B2B friction points worth flagging explicitly.
- Content and assets – what exists today to serve this touchpoint, and what’s missing?
- Tracking mechanism – how is this touchpoint actually measured: a UTM-tagged click, a postback event, a CRM-logged call, a support ticket?
- Owner – which team is responsible for this touchpoint: marketing, sales, partnerships, product, or support?
- KPI – the metric that tells you whether this stage is working: click-through rate, time-on-page, demo-to-opportunity conversion, view-through attribution rate, or churn.
Leaving out the tracking-mechanism and owner columns is the single most common reason journey maps get built once, presented in a meeting, and then never updated again.
Without a clear owner and a clear measurement method, nobody is accountable for keeping the map current.
How to Create a User Journey Map?
Follow these steps to build a user journey map that actually gets used.
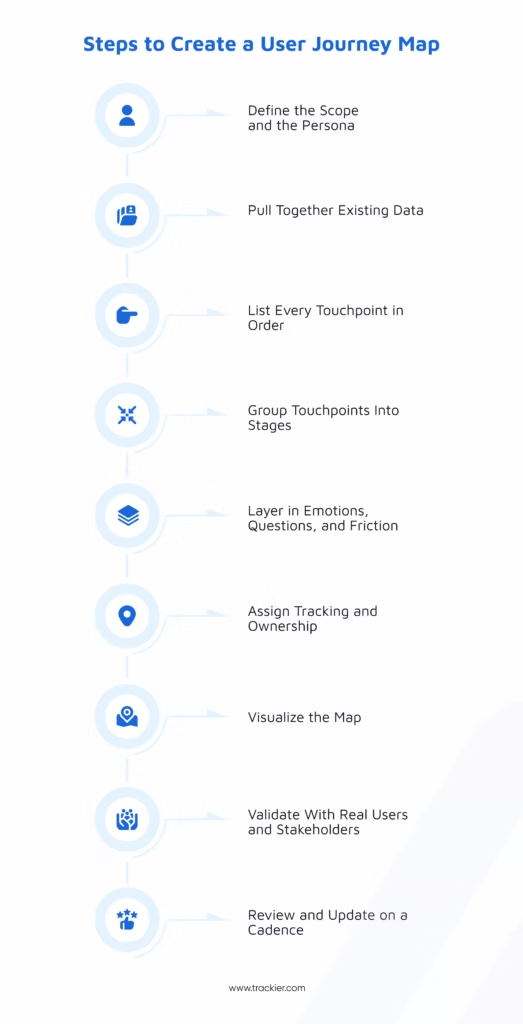
Step 1: Define the Scope and the Persona – Decide whether you’re mapping a single persona’s path to a single goal or a broader multi-persona buying-committee journey. Narrower scope produces a more actionable map; you can always build additional maps for other personas later.
Step 2: Pull Together Existing Data – Before you draw anything, gather what you already know: analytics data, CRM and sales-call notes, support tickets, affiliate and partner-tracking reports, win/loss interviews, and customer surveys. A journey map built entirely from assumptions is a guess with good formatting; one grounded in real click and conversion data is a working model.
Step 3: List Every Touchpoint in Order – Map out every interaction chronologically, across every channel: paid, organic, affiliate, email, sales, product, and support. Don’t filter yet, completeness first, tidiness later.
Step 4: Group Touchpoints Into Stages – Cluster the touchpoints into the awareness-through-advocacy stages. Some will span multiple stages; note that overlap rather than forcing a single stage per touchpoint.
Step 5: Layer in Emotions, Questions, and Friction – For each stage, ask what the buyer needs to feel confident about, and where that confidence currently breaks down. Sales and customer success input catches friction analytics alone won’t surface.
Step 6: Assign Tracking and Ownership – Define exactly how each touchpoint is measured and who owns fixing it if it underperforms. If a touchpoint can’t currently be tracked, like fallback traffic that doesn’t complete the intended flow, flag it as a gap rather than skipping it.
Step 7: Visualize the Map – Build the actual visual: a horizontal timeline is the most common format, with stages as columns and components (touchpoints, emotions, KPIs, owners) as rows.
Step 8: Validate With Real Users and Stakeholders – Test the map against actual buyer interviews, sales call recordings, or user research sessions.
Step 9: Review and Update on a Cadence – A journey map is a living document, not a one-time deliverable. Revisit it quarterly, or any time you launch a new channel, change pricing, or notice a shift in conversion rates at a specific stage.
Connecting Journey Maps to Attribution
This is where user journey mapping stops being a strategy exercise and becomes a measurement problem: once you know the stages and touchpoints, how do you actually prove which ones drove the conversion?
This is the job of attribution modeling.
By distributing credit across the multiple touchpoints in a path to purchase, multi-touch attribution captures the real contribution of each channel, rather than crediting a single interaction.
Where your user journey map identifies which touchpoints exist, an attribution model decides how much credit each one gets for the eventual conversion.
The two are meant to work together: a journey map without an attribution layer is a static diagram; an attribution model without a journey map is a black box nobody can explain.
A few attribution models come up repeatedly:
- First-touch attribution – credits the very first interaction, useful for understanding what drives initial awareness, but ignores everything that happened afterward.
- Last-touch attribution – credits the final interaction before conversion. It’s the easiest to measure and still the most widely used, but it systematically undervalues earlier touchpoints, like an affiliate placement or a display ad, that started the journey in the first place.
- Linear attribution – splits credit equally across every touchpoint. Simple, but it treats a passive impression the same as an active demo request.
- Position-based attribution – gives extra weight to the first and last touchpoints while splitting the remainder across the middle, a reasonable middle ground for teams that want to credit both discovery and closing moments.
- Data-driven attribution – uses machine learning to weight touchpoints based on actual conversion data, rather than applying a fixed rule. It’s the most accurate model but requires enough conversion volume to train reliably.
None of these models work without accurate, complete tracking data behind them, and this is where the technical side of performance marketing directly supports journey mapping.
A conversion that happens in-app three days after a click only gets attributed correctly if your server-to-server integration is passing that event back reliably.
A user who converts after seeing (but not clicking) an ad depends on view-through attribution being configured with the right lookback window.
And a partner who deserves credit for a delayed, multi-session conversion path only gets paid correctly if your postback settings and CAP limits are set up to capture that full path rather than truncating it at the first session.
In other words: the user journey map tells your team the story of how a click becomes a customer. Your attribution and tracking infrastructure is what proves that story is actually true, with data, not assumptions, and it’s what makes the map trustworthy enough to drive real budget decisions.
Common User Journey Mapping Mistakes (and How to Avoid Them)
- Mapping the journey you wish existed, not the one that does. It’s tempting to build a clean, linear map that matches your funnel slides. Real B2B journeys loop, stall, and restart. Ground the map in actual data and interviews, not the idealized version.
- Building it once and never revisiting it. Buyer behavior shifts, especially as channels like AI-assisted research grow. A map from eighteen months ago may already be missing entire touchpoints your buyers now rely on.
- Ignoring the buying committee. A single-persona map understates B2B complexity. If your deals typically involve six or more stakeholders, at least sketch the parallel paths of the two or three roles who influence the decision most.
- Skipping the tracking-gap analysis. If a touchpoint can’t currently be measured, don’t just leave it off the map, note it explicitly as a gap. That list becomes your tracking-infrastructure roadmap.
- Treating the map as a marketing-only artifact. The most useful journey maps are built with input from sales, customer success, and product, because friction often lives in the handoffs between teams, not within any single team’s channel.
- Optimizing only the touchpoints you can already measure. Last-touch bias creeps back in here: it’s easy to over-invest in the channel that shows up in your dashboard and under-invest in the dark-funnel touchpoints that quietly did the persuading.
What are the Tools and Technology for Journey Mapping and Tracking?
Journey mapping tools generally fall into three categories, and most performance marketing teams end up using at least one from each:
- Visualization and workshop tools (Miro, FigJam, Lucidchart) are best for turning raw touchpoint data into a shareable visual with input from multiple teams.
- Analytics and behavioral tools (product analytics platforms, heatmaps, session recordings) show what users actually do on owned properties, filling in the on-site behavior layer of the map.
- Attribution and tracking infrastructure is what makes the map’s conversion side trustworthy. This is the layer that captures clicks, stitches sessions, fires postbacks, applies attribution windows, and reconciles conversions back to the specific campaign, affiliate, or channel that earned credit.
For performance marketing teams specifically, this usually means a dedicated tracking platform rather than a general-purpose analytics tool, since affiliate, partner, and multi-channel campaigns need click-ID-level accuracy that standard web analytics wasn’t built to provide.
Used together, these three categories cover the full loop: visualize the journey, observe on-site behavior, and prove which touchpoints converted, closing the gap between “here’s our journey map” and “here’s the revenue it’s actually driving.”
Bringing It Together
A user journey map is only as useful as the data behind it. The stages, personas, and friction points give your team a shared story of how a buyer moves from a first click to a closed deal, but that story is only trustworthy if the tracking underneath it is accurate.
For performance teams running affiliate, partner, or multi-channel marketing, that means the same rigor that goes into building the map has to go into the postback settings, S2S tracking, and attribution windows that prove it. Get both right, and a user journey map stops being a workshop diagram and becomes the tool that actually explains where your next conversion is going to come from.
Frequently Asked Questions
1. What is a user journey map?
A user journey map is a visual timeline that shows every interaction a person has with a brand, from first awareness through conversion and beyond, organized by stage, channel, and the goals or emotions driving each step.
It helps marketing, product, and sales teams see the full path behind a conversion instead of just the last click.
2. Why is user journey mapping important in performance marketing?
Because B2B buyers now complete most of their research before ever contacting a company, often across ten or more touchpoints and channels a standard last-click report never captures.
Journey mapping surfaces those earlier touchpoints so budget and creative decisions reflect what actually influenced the buyer, not just what happened last.
3. What are the stages of a user journey map?
Most B2B user journey maps include six stages:
– Awareness
– Consideration
– Decision
– Conversion
– Onboarding
– Retention/Advocacy
Buyers rarely move through them in a straight line; they often loop back to earlier stages as new stakeholders join the evaluation.
4. What is the difference between a user journey map and a customer journey map?
A user journey map is narrower and task-focused, typically tracking one persona through one goal, like signing up for a trial.
A customer journey map is broader, spanning the full relationship across marketing, sales, and support.
Most B2B teams end up building a hybrid of the two.
5. What tools are used to build a user journey map?
Most teams combine three types of tools: a visualization tool (Miro, FigJam, Lucidchart) for the collaborative mapping process, analytics or session-recording tools for on-site behavior, and an attribution or tracking platform to confirm which touchpoints actually drove conversions.
6. How often should a user journey map be updated?
At least quarterly, and any time a new channel launches, pricing changes, or conversion rates shift noticeably at a particular stage.
Buyer research habits, especially the growing use of AI-assisted search, continue to change fast enough that a map older than a year is likely missing touchpoints.