Getting a customer through the door is expensive. Retention marketing helps the original acquisition spend create more value by keeping that customer active and willing to buy again.
The work becomes measurable after the first conversion, although expectations set during acquisition often shape what happens next. A customer acquired through a partner may need communication that reflects the product, promise, or offer that brought them in.
So, retention marketing goes beyond email. It includes onboarding, product use, service, timing, customer data, and clear measurement. Teams using an affiliate marketing platform can connect repeat purchases, renewals, and customer lifetime value with the partners and campaigns that acquired those customers.
This guide explains how retention marketing works, which strategies are useful across different business models, and how teams can measure whether customers continue creating profitable value.
What is Retention Marketing?
Retention marketing is the planned work a business does after acquisition to encourage customers to keep buying, renewing, using the product, or expanding their relationship. It combines onboarding, product experience, customer service, behavior-based communication, loyalty activity, and measurement to increase the value created after the first conversion.
It is broader than a campaign calendar.
A SaaS company may help a new user complete setup and adopt useful features. An ecommerce brand may send a reorder reminder based on the customer’s usual purchase cycle. An agency may share timely performance insights that help a client understand the value of continuing the contract.
The actions differ across business models. Each one helps customers receive continued value and gives them a relevant reason to stay.
What happens after the first conversion?
A conversion confirms that a customer completed one action. It does not show whether the customer will continue buying, using the product, or renewing.
The next interactions reveal whether the customer reaches a useful outcome and whether the experience matches the promise made during acquisition. Complicated setup can weaken SaaS adoption. Slow delivery updates can discourage a second ecommerce purchase. A partner campaign that sets the wrong expectation may produce customers who leave soon after converting.
Group customers by signup date, first purchase, plan, acquisition source, or product behavior. A cohort analysis can then show which groups remain active, purchase again, or disengage earlier. Trackier’s current cohort resource supports using shared customer characteristics to compare retention, engagement, and lifetime value over time.
How does retention marketing protect acquired customer value?
Every new customer carries an acquisition cost. The business may have paid for advertising, partner commissions, content, sales activity, introductory offers, or agency support before receiving the first payment.
A repeat purchase or renewal allows that original cost to support more revenue. An early cancellation gives the business less time to recover what it spent to acquire the customer.
Forrester reports that renewals and account expansion from existing customers contribute 61% of B2B revenue. The share is higher for established businesses and lower for companies still focused heavily on new-account growth.
Following customers beyond the first conversion also helps teams compare channels using customer lifetime value, repeat purchases, renewals, and upgrades. A source that produces fewer initial conversions may still create more value when its customers stay longer and spend more over time.
How are customer retention and loyalty different?
Customer retention describes continued behavior. A retained customer keeps buying, renewing, or using the product.
Customer loyalty describes preference. A loyal customer is more likely to choose the business again even when competing options are available.
A customer may stay because a contract has not ended, switching providers would take too much effort, or a suitable alternative is difficult to find. Retention can therefore remain stable while satisfaction and trust are falling.
Loyalty program enrolment also does not confirm active loyalty. A Deloitte survey of 5,564 US loyalty program members found that the average consumer was enrolled in eight programs but actively participated in five. The same research found that 72% were more likely to spend with their preferred brand because of its loyalty program.
Review repeat behavior beside product use, customer feedback, referrals, and stated reasons for staying. This helps teams distinguish customers who remain through preference from those who remain through convenience or contractual limits.
How is Retention Marketing Different From Customer Acquisition?
Customer acquisition brings new people into the business and works toward a first conversion. Retention marketing works with existing customers and encourages continued use, repeat purchases, renewals, or account growth.
Both support growth at different stages of the customer journey.
| Area | Customer acquisition | Retention marketing |
| Audience | Prospective customers | Existing customers |
| Main outcome | First purchase, signup, demo, installation, or subscription | Repeat purchase, continued use, renewal, referral, or expansion |
| Common activities | Paid media, search, content, affiliates, referrals, events, and outbound sales | Onboarding, product education, lifecycle communication, loyalty activity, account support, and win-back campaigns |
| Common measures | Customer acquisition cost, conversion rate, lead quality, and first-purchase revenue | Retention rate, repeat purchase rate, churn, revenue retention, and customer lifetime value |
| Main reporting question | Which source produced the conversion? | Did the acquired customer continue creating value? |
A customer acquisition funnel helps teams understand how prospects move from awareness to conversion. Retention reporting extends that view beyond the first action.
Suppose one campaign produces 1,000 trial users and another produces 600. Three months later, the first campaign has 50 active users while the second has 240.
The first campaign won on initial volume, the second produced a stronger retained customer group.
Connecting acquisition and retention data helps teams compare campaigns, audiences, offers, and partners using post-conversion results. A clear marketing attribution approach can link acquisition touchpoints with later outcomes such as repeat purchases, renewals, upgrades, and revenue.
This shared view can reveal whether weak retention comes from customer targeting, campaign promises, onboarding, product experience, or another stage of the journey.
Which Customer Actions Show That Retention Marketing Needs Attention?
Customers often show changes in behavior before they cancel, stop purchasing, or decide against renewal.
The signals vary by business model. A SaaS user may stop using a core feature. An ecommerce customer may take longer to place another order. A B2B account may reduce meeting attendance or remove users from the platform.
One isolated event rarely provides enough evidence. Compare the change with the customer’s previous behavior, normal buying cycle, and similar customer groups.
Is time to first value increasing?
Time to first value measures how long a customer takes to receive a useful outcome after conversion.
For a SaaS platform, this may involve completing setup, connecting data, inviting team members, or using a core feature. For an agency, it may involve receiving the first report or seeing an early campaign result. For ecommerce, it may include delivery, product use, and a smooth first service interaction.
Compare newer customer cohorts with earlier ones.
A longer journey may point to unclear onboarding, unnecessary setup steps, weak customer fit, or expectations that do not match the actual experience.
Is product use or purchase activity declining?
Customers do not need to become fully inactive before appearing at risk.
Early changes may include fewer logins, reduced feature use, lower order frequency, smaller purchases, fewer active users, or longer gaps between visits.
Compare customers with similar plans, buying cycles, account sizes, and use cases. A monthly buyer should not be judged against someone who purchases twice a year. An enterprise account should not be compared directly with a small team using an entry-level plan.
Segment-level monitoring gives teams a clearer warning than one activity threshold applied across the entire customer base.
Are support and feedback patterns changing?
A rise in support requests can point to product friction, billing confusion, service gaps, or expectations that have not been met.
Review the topic, frequency, severity, resolution time, and customer behavior after the issue is closed. Several basic questions may be less concerning than one unresolved problem blocking regular use.
Silence can also be informative.
A previously engaged customer who stops asking questions, attending reviews, completing surveys, or replying to account messages may already be disengaging. Treat the change as a prompt for investigation rather than proof that the customer plans to leave.
Are billing and renewal patterns becoming less stable?
Not every lost subscription results from dissatisfaction. Expired cards, declined transactions, outdated payment details, and processing failures can end a subscription even when the customer intended to continue. This is known as involuntary churn.
Review failed payment frequency, recovery rates, upcoming card expirations, invoice delays, and payment-method updates. Stripe’s revenue recovery guidance recommends tools such as automated retries and customer notifications for failed payments or expiring cards.
Which Retention Marketing Strategies Work Across Different Business Models?
Retention marketing follows the customer’s buying and usage cycle.
The following strategies can be adapted across these business models. Each one connects customer behavior with a practical response.
1. Improve the first customer experience
Remove unnecessary effort from the period immediately after conversion.
For an agency or B2B service company, the first experience may include a clear handover from sales, agreed goals, reporting expectations, and defined points of contact.
Review the actions customers complete before receiving their first useful outcome. Look for unclear instructions, long forms, repeated steps, missing information, and points where customers leave the process.
A welcome email can support the experience. The product, service, onboarding, and communication still need to deliver the promise made before conversion.
2. Segment customers using behavior and value
Group customers according to their current relationship with the business. Customer value can add another layer.
A high-value account with declining use may need personal outreach. A new customer who has not completed setup may need guidance. A frequent buyer may respond better to early access than another discount.
Retention marketing becomes more relevant when communication reflects the customer’s current stage and behavior.
Keep the number of groups manageable. Too many narrow segments can make campaigns difficult to run, compare, and improve.
3. Build communication around lifecycle moments
Send communication when an event creates a useful reason to contact the customer.
Timing gives the message context.
A tutorial may help after a customer struggles with a feature. The same tutorial may feel unnecessary after months of successful use. A reorder reminder can be useful near the customer’s usual purchase interval and annoying when sent too early.
Use customer activity to guide timing when the data is reliable. Avoid reacting to every small event. Too many automated messages can make a thoughtful program feel mechanical.
Different channels suit different moments.
| Channel | Suitable Uses |
| Onboarding, education, account updates, renewal preparation, and longer explanations | |
| SMS | Payment alerts, delivery updates, appointment reminders, and time-sensitive communication |
| In-app Messaging | Product guidance based on the customer’s current activity |
| Push Notifications | Short reminders for customers who have chosen to receive them |
| Direct Account Outreach | Complex B2B concerns, valuable accounts, and renewal discussions |
| Loyalty Programs | Repeat purchases, customer recognition, and rewards |
| Customer Communities | Education, peer support, feedback, and advocacy |
Choose the channel based on urgency, complexity, customer preference, and the type of response required.
4. Educate customers before asking them to spend more
Help customers receive greater value from what they already purchased.
Education can improve adoption without turning every interaction into a sales request.
Expansion offers can follow when customer activity shows readiness. An upgrade suggestion becomes more relevant after a customer reaches a usage limit or adopts an advanced workflow. Sending it during the first week may distract from onboarding.
Review whether educational content leads to product use, repeat purchases, account growth, or renewal. Content consumption alone does not confirm commercial progress.
5. Personalize the parts of the experience that help the customer
Use personalization to make communication more relevant.
Useful personalization may include:
- A reorder reminder based on the customer’s normal purchase cycle
- Training based on the features used by an account
- A renewal review based on adoption and results
- Product recommendations connected to earlier purchases
- Regional information related to service availability or events
Using the customer’s name while sending an irrelevant offer adds little value.
Use data according to customer permission, stated preferences, applicable privacy requirements, and the purpose for which it was collected. Collect only the information needed for the intended experience and protect the data that is retained. The FTC provides further privacy and security guidance for businesses.
Personalization should be understandable from the customer’s point of view. Communication can feel intrusive when customers cannot see why they received it.
6. Reduce friction around repeat purchases and renewals
Review every step a customer must complete to continue the relationship.
For subscription businesses, failed payments need a separate recovery process. Payment platforms like Whop retry a declined card automatically, so fewer renewals lapse just because a card expired. Use well-timed reminders, suitable payment retries, and a simple way to update billing information. For B2B customers, begin renewal preparation before the contract end date. Review usage, results, open concerns, changing needs, and the people involved in the decision. For ecommerce customers, make repeat ordering simple. Save preferences where permission exists, provide accurate stock information, and explain subscription or reorder terms clearly.
7. Reward behavior that supports a healthy customer relationship
Use rewards with a defined purpose.
The reward does not always need to be a discount. Customers may value priority support, early access, useful training, exclusive content, additional product usage, or greater flexibility.
Before launching an incentive, decide which behavior should change and how success will be measured.
Review whether customers continue the behavior after the reward ends. A campaign that creates a temporary increase in purchases without improving longer-term value may cost more than it returns.
Include discount costs, reward costs, service time, campaign spending, and manual account effort when evaluating the result.
8. Connect retention marketing results with acquisition sources
Compare customer quality across campaigns, audiences, partners, creatives, and offers.
One source may produce inexpensive first conversions followed by weak adoption or early churn. Another may cost more at the beginning while producing stronger repeat purchases, renewals, or account growth.
Track post-conversion outcomes by acquisition source. Useful measures may include onboarding completion, time to first value, active usage, repeat purchase rate, renewal, expansion revenue, and customer lifetime value.
Use the findings to review campaign budgets, targeting, partner commissions, landing pages, and offer messaging.
A high conversion rate becomes less valuable when the acquired customers rarely stay. A source producing stronger customer value may deserve more investment even when its initial acquisition cost is higher.
9. Build win-back journeys around the reason the customer left
Separate inactive or former customers according to their likely reason for disengaging.
One win-back offer will not suit every situation.
A customer who experienced poor service may need acknowledgement and a clear resolution. A former buyer may need a reminder based on the usual purchase cycle. A SaaS customer who never completed setup may need onboarding help rather than a discount.
Review cancellation responses, account history, product use, billing records, and support conversations before selecting the approach.
Set a limit on how often former customers are contacted. Remove people who have opted out, requested no further communication, or no longer fit the product.
A win-back journey should create a relevant opportunity to return. Repeated generic offers can weaken trust and raise campaign costs.
How Should Teams Measure Customer Retention & Long-Term Value?
Retention marketing reporting should explain more than how many customers remain active.
No single metric provides the complete answer. Customer counts, repeat behavior, recurring revenue, lifetime value, and cohort performance need to be reviewed together.
Use the same customer definition and measurement period each time. Do not mix paying customers with trial users, free accounts, or paused subscriptions unless the reporting rules clearly explain how each group is treated.
What is customer retention rate?
Customer retention rate measures the percentage of existing customers who remain with the business during a selected period.
The calculation is:
Customer retention rate = ((Customers at the end of the period − New customers acquired during the period) ÷ Customers at the beginning of the period) × 100
Suppose a company begins the quarter with 1,000 customers. It ends with 1,100 customers after acquiring 250 new ones.
The company retained 850 of its original customers.
Customer retention rate = (850 ÷ 1,000) × 100 = 85%
Choose a period that reflects the customer relationship. A monthly view may suit an app or ecommerce subscription. A quarterly or annual view may be more useful for B2B companies with longer contracts.
Review the rate by plan, customer size, region, acquisition source, and use case. A company-wide percentage can hide weak performance within an important customer group.
How to calculate customer churn?
Customer churn rate measures the percentage of customers who leave during a selected period.
The calculation is:
Customer churn rate = (Customers lost during the period ÷ Customers at the beginning of the period) × 100
Separate voluntary and involuntary churn where possible.
Voluntary churn may result from price, poor fit, low usage, service problems, changing needs, or a competing product. Involuntary churn may come from declined payments, expired cards, or billing errors.
The distinction guides the response. A product concern may require service or product changes. A failed payment may require an automated retry and a clear billing reminder.
Use consistent churn categories across cancellation forms, account notes, support records, and billing systems. Open comments can add context, but standardized categories make trends easier to compare.
How can transaction-based businesses measure repeat behavior?
Repeat purchase rate measures the percentage of customers who make at least two purchases within a defined period.
The calculation is:
Repeat purchase rate = (Customers who purchased more than once during the period ÷ Total customers during the period) × 100
Always state the measurement window.
A repeat purchase rate measured over 30 days cannot be compared directly with one measured over a full year. The percentage will often increase as customers have more time to place another order.
Purchase frequency and average time between orders add useful context. A stable repeat purchase rate can still hide customers who are buying less frequently or spending less per order.
Website return behavior can provide an earlier indicator, although it should not be treated as customer retention.
Contentsquare’s digital experience benchmark found that returning visitors accounted for 52.8% of website traffic and converted at 2.9%, compared with 1.7% for new visitors.
These figures describe website visits and conversion events. They do not show how many paying customers were retained.
What is the difference between gross and net revenue retention?
Customer retention gives each account equal weight. Revenue retention shows the financial effect of cancellations, reduced spending, renewals, and account growth.
Gross revenue retention measures the percentage of recurring revenue retained from customers who were active at the beginning of the period. It excludes upgrades, cross-sells, and other expansion revenue.
The calculation is:
Gross revenue retention = ((Starting recurring revenue − Churned revenue − Contraction revenue) ÷ Starting recurring revenue) × 100
Gross revenue retention cannot exceed 100%.
Net revenue retention includes expansion revenue from the same starting customer group.
The calculation is:
Net revenue retention = ((Starting recurring revenue + Expansion revenue − Churned revenue − Contraction revenue) ÷ Starting recurring revenue) × 100
Net revenue retention can exceed 100% when upgrades, added seats, cross-sells, or increased usage are greater than revenue lost through churn and contraction.
Use only customers who were active at the beginning of the period for both calculations. Exclude revenue from customers acquired during the measurement window.
A company can report strong NRR while losing many smaller customers because expansion from a few large accounts covers the lost revenue. GRR reveals how much original revenue was protected before expansion is added.
Benchmarks also vary by contract value.
Among the private B2B SaaS companies surveyed by SaaS Capital, businesses with annual contract values between $25,000 and $50,000 reported a median NRR of 102%.
Use external benchmarks for context. The more useful comparison is often the company’s performance across customer groups and measurement periods.
How should customer lifetime value be calculated?
Customer lifetime value estimates the value a customer is expected to create throughout the relationship.
For ecommerce and transaction-based businesses, a simple calculation is:
Customer lifetime value = Average purchase value × Average purchase frequency × Average customer lifespan
For subscription businesses, a simple calculation is:
Customer lifetime value = Average revenue per customer per period × Average customer lifespan measured in the same periods
The time units must match. Monthly revenue should be multiplied by a lifespan measured in months, while annual revenue should be multiplied by a lifespan measured in years.
Businesses with reliable margin data can use gross profit instead of revenue. This accounts for fulfillment, support, service, reward, and delivery costs that can make a high-revenue customer less profitable than the topline figure suggests.
Review customer lifetime value by plan, market, acquisition source, partner, first offer, and customer size.
An overall average can hide large differences. One campaign may attract customers who purchase once. Another may bring customers who renew, expand, or purchase repeatedly.
How can cohort analysis reveal changes earlier?
A cohort groups customers around a shared starting point or behavior.
An acquisition cohort may include everyone who became a customer during the same month. A behavior-based cohort may include customers who completed onboarding, adopted a feature, used a discount, or came through a particular partner.
Compare how each group performs after the same amount of time.
For example, compare customers after 30, 60, and 90 days rather than comparing a six-month-old customer group with one acquired last week.
Cohort reporting can reveal whether a product update improved adoption, whether a new offer brought weaker customers, or whether an onboarding change helped customers remain active.
A company-wide retention rate may stay stable while newer customer groups perform worse. Cohort analysis makes the decline easier to identify.
Which metrics suit each business model?
The best measurement set depends on how customers buy and receive value.
| Business Model | Useful Retention Marketing Measures |
| Ecommerce | Repeat purchase rate, purchase frequency, average time between orders, customer lifetime value, and retained gross profit |
| Subscription SaaS | Customer retention rate, product adoption, customer churn, GRR, NRR, expansion revenue, and customer lifetime value |
| Agencies and B2B services | Contract renewal, retained revenue, account growth, stakeholder engagement, gross margin, and service cost |
| Mobile apps | Active users, cohort retention, subscription renewal, in-app purchases, uninstalls, and customer lifetime value |
| Partner-led businesses | Repeat conversions, retained revenue, customer lifetime value, and renewal performance by partner or campaign |
Avoid adding every available metric to one dashboard. Select measures that connect customer behavior with revenue and a decision the team can act on.
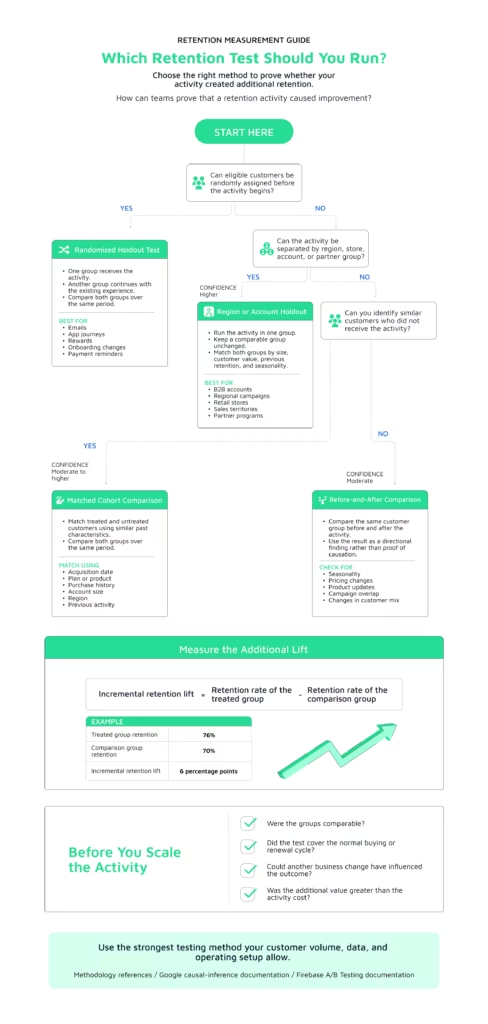
How can teams prove that a retention activity caused improvement?
A repeat purchase or renewal that happens after a campaign was sent is not automatically caused by the campaign.
Some customers would have returned without receiving an email, reward, reminder, or account intervention.
Use a holdout group when the customer volume allows it. Keep a comparable group out of the campaign and compare its result with the customers who received the activity.
The calculation is:
Incremental retention lift = Retention rate among exposed customers − Retention rate among comparable unexposed customers
Suppose 76% of customers who received a renewal program stayed, while 70% of a comparable holdout group stayed.
The incremental retention lift was 6%.
Matched customer groups can be used when a randomized holdout is not practical. Compare customers with similar purchase history, plan, account size, acquisition source, or prior activity.
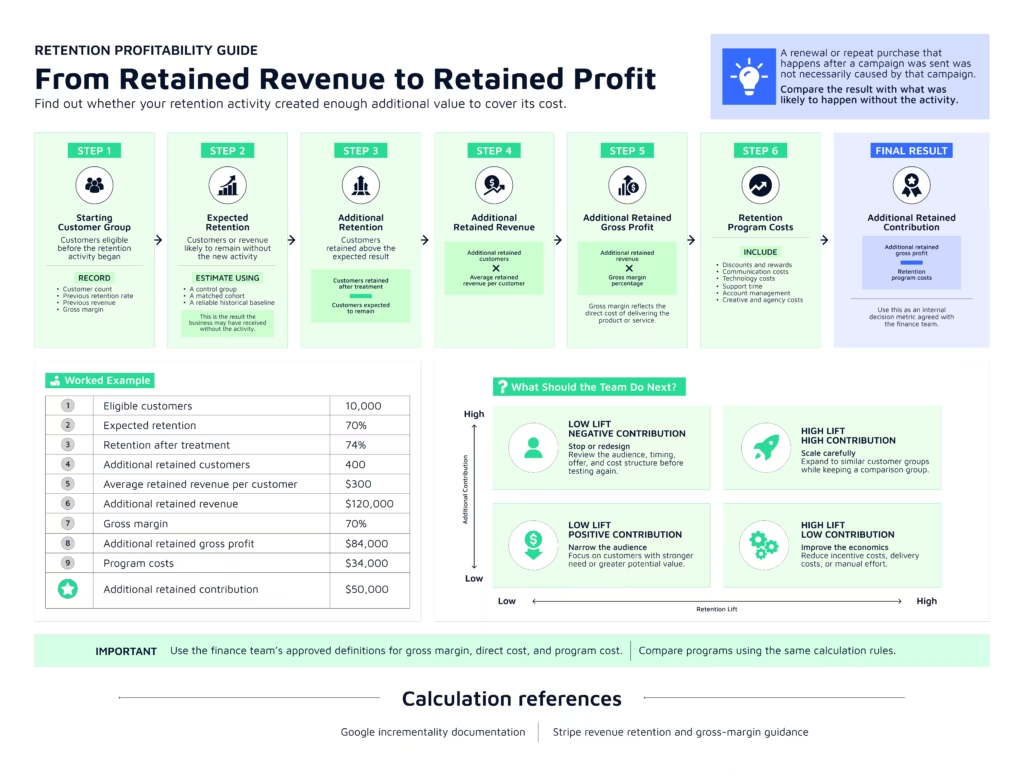
Include the cost of discounts, rewards, communication, customer service, and manual account work when calculating the financial result.
The final assessment should show whether the activity created additional retained revenue or profit beyond what was likely to happen without it.
How should retention marketing data improve acquisition reporting?
Add the acquisition source, campaign, partner, offer, creative, and landing page to retention reports where the data is available.
Then compare customer groups using a focused set of outcomes such as:
- Time to first value
- Repeat purchase rate
- Customer retention rate
- Gross revenue retention
- Net revenue retention
- Customer lifetime value
- Expansion revenue
- Retained gross profit
- Churn reason
The lowest-cost conversion source may not produce the highest-value customers.
A channel with a higher acquisition cost may generate stronger returns when its customers remain active, renew, expand, or purchase again. Retention reporting allows teams to judge acquisition using the value created after conversion rather than the first action alone.
Why Do Retention Marketing Programs Lose Momentum?
Retention programs often weaken through operational gaps rather than one obvious failure.
Customers experience the combined result. They do not separate marketing, product, billing, support, and sales when the experience falls short.
PwC’s Customer Experience Survey found that 52% of US consumers had stopped buying from a brand after a poor product or service experience. Another 29% had stopped because of a poor online or in-person customer experience.
These findings show why campaign activity cannot compensate for unresolved problems elsewhere in the relationship.
Treating retention as a communication calendar
A sequence of emails, push notifications, or account check-ins does not automatically improve customer retention.
Messages can remind customers about value. They cannot replace value that is missing.
A SaaS customer struggling with setup needs help completing the process. More feature announcements may add information without resolving the original issue.
An ecommerce customer waiting for a delayed refund needs a clear update and resolution. A discount on the next order may feel disconnected from the current experience.
Plan communication around customer behavior, needs, and lifecycle moments. The calendar should support the customer journey rather than decide it.
Using one average for every customer
A company-wide retention rate can appear stable while an important customer group is declining.
Enterprise accounts may renew at a high rate while smaller customers leave early. One region may produce strong repeat purchases while another struggles after the first order. Customers from one campaign may convert quickly and disengage soon afterward.
Break reporting down by customer type, plan, acquisition source, region, use case, and acquisition period.
Company-wide averages can support executive reporting. Group-level results are more useful when deciding which experience, campaign, or process needs attention.
Keep each group large enough to produce a useful comparison. Very small cohorts can create sharp percentage changes based on only a few customers.
Offering discounts before finding the cause
A discount may bring a customer back for one transaction. It does not explain why the customer stopped buying or using the product.
Review the customer’s history before choosing an offer.
Customers facing billing problems need a simpler payment path. Customers who never completed setup may need onboarding support. Customers who experienced poor service may need acknowledgement and a clear resolution.
Frequent discounts can also teach customers to wait for a lower price. Use an incentive when it fits the reason for disengagement and the expected retained value supports the cost.
Automating interactions without clear limits
Automation helps teams respond to customer behavior across large customer groups. It can also create awkward experiences when campaigns lack suppression rules and human review.
A customer with an unresolved complaint should not enter a standard upsell journey. Someone who recently cancelled should not receive a message celebrating product usage. A valuable B2B account approaching renewal may need a direct conversation rather than another automated reminder.
Create exclusion rules for complaints, cancellations, legal concerns, sensitive billing issues, and accounts already receiving personal support.
Route complex service problems, pricing discussions, repeated support requests, and valuable renewal risks to the appropriate person. Well-designed ticketing systems also help ensure these requests are assigned, tracked, and resolved consistently as customer needs evolve.
Review automated journeys regularly for overlapping messages, outdated conditions, incorrect customer groups, and communication that no longer fits the customer’s situation.
Automation should help the business respond with greater consistency. It should not remove judgment from interactions that require context.
What Should You Do Next?
A retention marketing program does not need to begin with a large loyalty scheme, a new software stack, or dozens of automated journeys.
Begin with one customer group, one behavior change, and one outcome the business can measure.
Calculate the existing retention rate for a period that fits the buying cycle.
Review repeat purchases, customer churn, revenue retention, lifetime value, and product activity where they apply. Break the results down by customer type, plan, acquisition source, region, or use case. The baseline gives the team a point of comparison before any campaign or customer experience change is introduced.
Choose a group with a clear shared condition. Starting with one group makes the customer behavior easier to study and the response easier to evaluate.
Look for the point where the customer journey begins to weaken. The change may be a delayed setup, fewer active users, a longer gap between purchases, repeated support requests, lower feature use, or reduced participation in account reviews.
A cancellation confirms that the relationship has ended. An earlier behavior change gives the team time to respond.
Choose an action connected to the likely cause. Avoid changing several parts of the journey at once. A focused test makes it easier to understand which action affected the result.
Track early behavior and financial outcomes. Use a holdout group or comparable customer cohort when possible. This helps separate the effect of the retention activity from purchases or renewals that may have happened without it.
Include the cost of discounts, rewards, communication, service time, and manual account work in the final calculation.
Share the results with marketing, product, sales, support, finance, and account management teams. The findings may lead to clearer campaign promises, better customer targeting, a simpler onboarding step, improved product education, earlier renewal preparation, or changes to partner spending.
Retention marketing works as a continuous learning process. Study customer behavior, test a relevant response, measure the result, and use the findings to improve the next customer experience.
A business does not need to retain every customer indefinitely. It needs to understand which relationships create profitable value, what helps those customers continue, and which avoidable problems cause them to leave.
Hungry for more? Download our free case studies that cover real stories.
Or sign up for Trackier’s newsletter to get weekly best practices on referral programs and partner marketing.
Frequently Asked Questions
1. How long does retention marketing take to show results?
The timeline follows the customer’s normal purchase, usage, or renewal cycle. An ecommerce business selling frequently purchased products may see changes in repeat orders within weeks. A B2B company with annual contracts may need several months before renewal data becomes available.
Use early indicators while waiting for financial outcomes. Onboarding completion, product adoption, payment recovery, purchase frequency, and customer engagement can show whether behaviour is moving. Final evaluation should still include repeat revenue, renewal, churn, and customer lifetime value.
2. Who should own retention marketing?
One team should coordinate the program, though retention rarely belongs to one department alone.
Marketing may manage lifecycle communication. Product teams influence adoption. Support teams see recurring customer problems. Sales and account managers handle renewals. Finance manages billing and payment recovery.
Assign one accountable owner who can set priorities, maintain shared reporting, and coordinate action across teams. Without clear ownership, each department may respond to a different customer signal while no one reviews the complete relationship.
3. How should a company set a customer retention target?
Begin with the company’s current performance rather than selecting a broad industry average.
Calculate retention by product, plan, customer size, region, acquisition source, and contract type. Review several periods to account for seasonal changes or unusually large customer losses.
Targets should also reflect the buying cycle. Monthly subscriptions, annual software contracts, and occasional ecommerce purchases cannot share the same review window. Customer retention rate provides one view, while revenue retention shows how account expansion and contraction affect the financial result.