Campaign performance is never about one number, especially for publishers. Clicks can tell you how much traffic a campaign is receiving, but conversions, revenue, payouts, profit, and other performance metrics help build a more complete picture.
It is difficult to have all of that information in one place and to also understand what it means without constantly switching between different views.
Trackier’s publisher dashboard brings key campaigns and performance data into one dashboard. This gives the publishers a single way to –
- Monitor campaigns
- Understand performance
- Identify areas that require closer attention
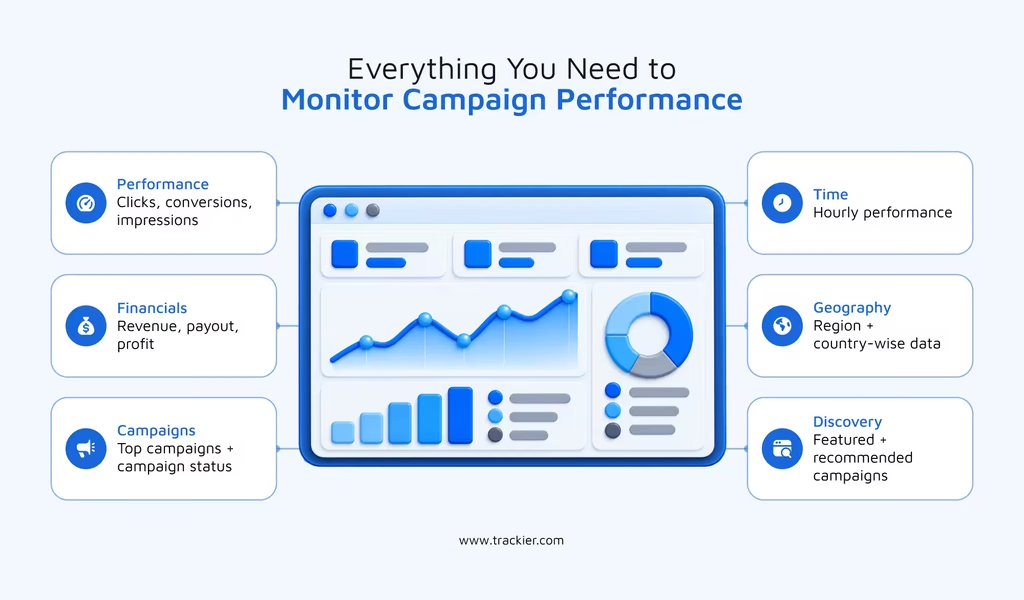
The dashboard includes performance reports along with widgets covering campaigns, financial metrics, hourly performance, coupons, and campaign recommendations.
A Dashboard Built Around the Metrics That Matter
The Publisher Dashboard gives publishers access to the campaigns they are running and helps them measure how those campaigns are performing.
How does it work?
- At the center of the dashboard is the performance report, which provides data on clicks, conversions, revenue, impressions, payouts, and profits for a selected date range.
- Publishers can also reduce the attributes shown in the report by selecting a specific metric and download or print the report in PNG, JPEG, or PDF formats.
This makes the dashboard useful for checking whether a campaign generated activity and looking at the different parts of campaign performance together.
For example, a publisher may want to look beyond clicks and understand how those clicks translate into conversions, revenue, and profit. Having these metrics available through the same performance view makes it easier to focus on the numbers relevant to a particular analysis.
Check the Campaigns and Sources that are Performing
Not every campaign contributes equally to overall performance. That is why the dashboard includes views that help publishers identify their top-performing campaigns, publishers, and advertisers.
The Top Campaigns, Publishers, and Advertisers widget shows the top 10 performers and allows the data to be viewed as either a table or a pie chart.
- The dashboard also provides campaign data, where publishers can view information about active, paused, pending, and disabled campaigns.
- The widget also provides pie-chart views for top campaigns as well as region- and country-wise data, with the ability to choose the data they want to see.
When used together, these views can help publishers move from a broad performance overview to a more focused look at where campaign activity is coming from and which campaigns are standing out.
Look Beyond Clicks with Conversions and Financial Data
Clicks and impressions show activity, but publishers also need visibility into what that activity contributes to their overall performance.
The dashboard includes a Clicks, Conversions and Impressions widget. When viewing conversions, publishers can also see approved and rejected conversion data.
There is also a dedicated Payout, Profit, and Total Revenue widget. It provides financial performance information around total payout, revenue, and profit, helping publishers track campaign profitability, overall business growth, and revenue forecasting.
Understand Performance Throughout the Day
A campaign’s performance can also be viewed through an hourly lens.
The Hourly Data widget updates every hour and shows attributes such as clicks, conversions, payouts, revenue, earnings per click, and profit.
This gives publishers a more time-specific view of their campaign data. Instead of only looking at performance across a broader date range, they can also examine the hourly attributes available in the dashboard.
Turn Dashboard Data Into Better Performance Decisions
A dashboard becomes more useful when the data can support the questions publishers ask about their campaigns.
The publisher dashboard brings data relevant to these questions into different views, allowing publishers to look at campaign performance from multiple angles.
Trackier also recommends regularly reviewing dashboard performance, prioritising high-quality traffic sources, testing multiple campaigns, analysing campaign performance across regions and devices before scaling traffic, and periodically exporting performance reports for deeper analysis and record-keeping.
The idea here is not just limited to gathering more data. It is to make the data easier to access and organise around the areas publishers need to monitor as they manage their campaigns.
A Complete View of Publisher Performance
Campaign performance involves more than tracking a single metric. Publishers may need to consider traffic, conversions, revenue, payouts, profit, campaign status, geographic performance, and campaign opportunities.
Trackier’s publisher dashboard brings these different views together, from performance reports and financial metrics to hourly data and campaign discovery. This gives publishers a central place to monitor their campaigns and explore the performance information available to them.
For publishers looking to make their campaign monitoring more structured, the dashboard provides the visibility needed to move from individual metrics toward a broader view of campaign performance.