World Cup 2023 – it’s time to glue your eyes to the screen- be it on the television or your performance marketing dashboard. While scoring bigs on the pitch is thrilling for players, scoring big in performance campaigns is no less than a dose of adrenaline rush for marketers. To accelerate performance marketers’ journey to success this World Cup season, we’ve introduced Heatmaps for Performance Marketing campaigns in our dashboard and this blog is going to explain how to make the best use of it.
But before that, here’s a quick explainer of what heatmaps are and how they help your campaigns.
What are Heatmaps and How Do They Help?
Heatmaps must remind you of the daily weather report with amber reds in the center and ice blue in the peripheries. In marketing, heatmaps are similar, aside from the fact that they are used to visualize data – clicks, impressions, conversions, engagement, etc.
While heatmaps look similar everywhere, there’s no common standard as to how heatmaps are used across different scenarios. Generally, the red, orange, green, and yellow show higher concentrations of data points while the areas of green and blue represent little to no concentration.
Use Cases of Heatmaps
- Heatmaps help to represent data in a more visually appealing and understandable way.
- They also help in validating A/B testing of campaigns in terms of creatives, time targeting, geographies, copy, CTA, etc.
- Heatmaps are used in mobile apps to understand how users are navigating the app and optimize the UX as per their liking.
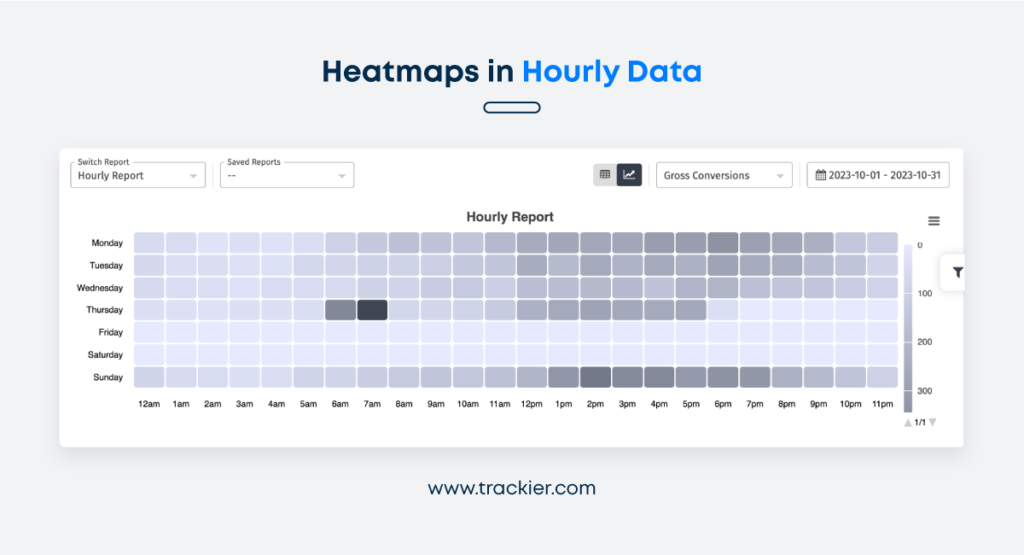
Heatmaps for Hourly Data in Trackier Performance Marketing Software
Trackier user can now benefit from the Heatmaps for their Performance Marketing campaigns. They simply have to log in to their Performance Marketing Software and go to Hourly Report to analyze hourly campaign data on attributes of their preference. Let’s explore where to find these heatmaps and how to use them for your World Cup 2023 campaigns.
How to Access Hourly Data in Heatmaps?
- Login to your Performance Marketing Software and go to Reports>Hourly Report.
- Click on the ‘funnel sign’ on the mid-right of the screen and select the campaign/publisher/advertiser you want to analyze.
- Click on submit.
- Select the ‘graph sign’ on the top right of the report. It will lead you to the heatmaps of your hourly data for the selected campaign. You can further add filters, time ranges, etc by using the buttons on the top panel.
How to Use Hourly Data in Heatmaps for Your World Cup 2023 Campaigns?
Marketers are preparing to ride high on the World Cup 2023 wave with meticulously crafted and targeted campaigns to lure their target audience. Brands, especially eCommerce brands work with multiple partners and affiliates to expand their reach throughout every channel, be it social media or search engines. It is imperative that the campaign managers deal with multiple campaigns and heaps of data to analyze their campaign performance and optimize them further throughout the tenure of the World Cup.
To make data analysis and further campaign optimization easier for our users, our hourly reports are now available in Heatmaps. In the above section, we’ve already explained how to access Heatmaps on your performance marketing software. Now, let’s delve into how this powerful tool can revolutionize your data analysis and campaign optimization efforts.
- Real-Time Content Tweaks: To A/B/ test your campaign creatives and content, you can split your campaigns into two parts spanning across the duration of the World Cup 2023 – let’s say Campaign A & Campaign B. Time target campaign A from Time 1 to Time 2 and campaign B from Time 3 to Time 4. Analyze hourly reports to track conversions, impressions, and clicks to analyze which creatives/copy is working the best and when. Tweak the content and creative according to the winning campaign in the A/B test.
- Optimizing Ad Placement: With the help of heatmaps, brands or advertisers can identify the prime hours where the campaigns perform the best. This data can help them optimize their campaigns for maximum visibility and impact. If your heatmaps show higher conversions during the half time, that’s where you’d want to put your money in.
- Geographic Targeting: Brands can split their World Cup 2023 campaigns into multiple parts on the basis of geographies. Heatmaps can allow them to analyze which campaigns show the highest conversions or impressions during the World Cup streaming. For example, if the hourly data shows that the campaign run in India shows a higher concentration of conversions during the World Cup hours in comparison to the one run in the UK, you know where to put your money. .
- Budget Allocation: Hourly heatmaps can help brands allocate their advertising budgets more effectively. If they observe that engagement and conversions are consistently higher during certain hours or days of the week, they can adjust their budget allocation to prioritize those peak periods for ad spend, optimizing their return on investment.
The World Cup is not just played among the players, but also among the brands who are betting big on their marketing campaigns. That’s why it is important to have the right kind of data along with the strategies to outperform your competitors.
So, as the excitement builds up, don’t miss out on the chance to take your marketing performance to the next level with Heatmaps and hourly data.
We hope this blog has provided you with valuable insights and guidance on how to use Heatmaps effectively during the World Cup. Now it’s your turn to put this knowledge into action and score big in your marketing campaigns. Here’s to a victorious World Cup 2023 both on and off the field!